Abstract
1. Introduction
2. Methods
2.1. Metric of Health Composition in Ageing
2.2. Other Participants’ Characteristics
2.3. Alcohol Drinking
2.4. Statistical Analysis
3. Results
Table 1. Baseline characteristics of the study—overall harmonised sample by alcohol drinking.
| Overall Harmonised n, (%) | Alcohol Drinking Frequency | Current Drinker | Past Drinker | |||||||||
|---|---|---|---|---|---|---|---|---|---|---|---|---|
| Characteristic | Category | Never n, (%) | Rare n, (%) | Often n, (%) | p value | No n, (%) | Yes n, (%) | p value | No n, (%) | Yes n, (%) | p value | |
| Sex | Female | 75,246 (55.56%) | 41,533 (33.70%) | 17,594 (14.27%) | 8518 (6.91%) | p < 0.001 | 45,507 (34.93%) | 26,689 (20.48%) | p < 0.001 | 20,736 (51.79%) | 4019 (10.03%) | p < 0.001 |
| Male | 60,194 (44.44%) | 21,060 (17.09%) | 16,020 (12.99%) | 18,528 (15.03%) | 22,900 (17.58%) | 35,158 (26.99%) | 8809 (22.00%) | 6473 (16.16%) | ||||
| Education | ≤Primary | 25,131 (20.31%) | 14,235 (12.59%) | 4045 (3.58%) | 3323 (2.94%) | p < 0.001 | 16,784 (13.95%) | 7584 (6.30%) | p < 0.001 | 10,758 (30.26%) | 4138 (11.64%) | p < 0.001 |
| Primary | 36,910 (29.83%) | 18,581 (16.43%) | 7433 (6.57%) | 6365 (5.63%) | 21,279 (17.69%) | 14,275 (11.86%) | 7133 (20.06%) | 3587 (10.09%) | ||||
| Secondary | 45,673 (36.92%) | 18,665 (16.50%) | 14,534 (12.85%) | 10,504 (9.29%) | 19,265 (16.01%) | 25,427 (2.11%) | 5258 (14.79%) | 1793 (5.04%) | ||||
| Tertiary | 16,005 (12.94%) | 5329 (4.71%) | 5175 (4.57%) | 4907 (4.34%) | 5458 (4.53%) | 10,205 (8.48%) | 2275 (6.39%) | 605 (1.70%) | ||||
| Wealth | 1st Quintile | 30,583 (25.52%) | 16,590 (15.05%) | 6439 (5.84%) | 4345 (3.94%) | p < 0.001 | 18,207 (15.68%) | 11,114 (9.57%) | p < 0.001 | 7721 (21.37%) | 2539 (7.02%) | p < 0.001 |
| 2nd Quintile | 26,753 (22.32%) | 12,421 (11.27%) | 7006 (6.35%) | 5279 (4.79%) | 13,441 (11.57%) | 12,545 (10.80%) | 4423 (12.24%) | 1434 (3.96%) | ||||
| 3rd Quintile | 24,928 (20.80%) | 11,819 (10.72%) | 6392 (5.80%) | 4953 (4.49%) | 12,653 (10.89%) | 11,602 (9.99%) | 5652 (15.64%) | 1874 (5.18%) | ||||
| 4th Quintile | 19,977 (16.67%) | 9053 (8.21%) | 5242 (4.75%) | 4334 (3.93%) | 9617 (8.28%) | 9818 (8.45%) | 4494 (12.44%) | 1729 (4.78%) | ||||
| 5th Quintile | 17,597 (14.68%) | 7793 (7.07%) | 4273 (3.87%) | 4226 (3.83%) | 8341 (7.18%) | 8755 (7.54%) | 4376 (12.11%) | 1880 (5.20%) | ||||
| Ever smoker | Yes | 55,383 (41.79%) | 19,379 (15.76%) | 15,875 (12.91%) | 16,866 (13.71%) | p < 0.001 | 20,863 (16.02%) | 33,478 (25.71%) | p < 0.001 | 7268 (18.05%) | 5870 (14.58%) | p < 0.001 |
| Physical activity | High | 6812 (24.73%) | 3912 (15.2%) | 1203 (4.68%) | 1321 (5.14%) | p < 0.001 | 3896 (15.15%) | 2554 (9.93%) | p < 0.001 | 2710 (16.40%) | 1011 (6.12%) | p < 0.001 |
| Moderate | 9864 (35.81%) | 6575 (25.61%) | 1422 (5.54%) | 1291 (5.03%) | 6604 (26.68%) | 2690 (10.46%) | 5371 (32.51%) | 1624 (9.83%) | ||||
| Low | 6799 ((24.68%) | 4493 (17.50%) | 1090 (4.24%) | 808 (3.14%) | 4541 (17.66%) | 1851 (7.19%) | 3353 (20.29%) | 995 (6.02%) | ||||
| Inactive | 4070 (14.77%) | 2330 (9.07%) | 490 (1.90%) | 729 (2.84%) | 2298 (8.93%) | 1279 (4.97%) | 1153 (6.97%) | 302 (1.82%) | ||||
| CVD | Yes | 22,056 (20.15%) | 10,497 (10.24%) | 6376 (6.22%) | 4194 (4.09%) | p < 0.001 | 10,820 (10.15%) | 10,614 (9.95%) | p = 0.93 | 2897 (8.95%) | 1282 (3.96%) | p < 0.001 |
Ageing Trajectories of Health: Longitudinal Opportunities and Synergies (ATHLOS) project; education classification was based on the International Standard Classification of Education; physical activity’s four classification groups were created based on the frequency and intensity of physical activity and inactive group reflects no physical activity.
Table 2. Results from multiple linear regression models that evaluated the association between healthy ageing and the alcohol drinking, among the n = 135,440 ATHLOS study participants.
| Outcome | Categories | b-Coefficient | 95%CI |
|---|---|---|---|
| Model 1 | |||
| Frequency of alcohol drinking | Reference | ||
| Rare | −0.50 | −1.43, 0.43 | |
| Often | 3.70 *** | 2.67, 4.73 | |
| Model 2 | |||
| Current alcohol drinking | Yes vs. No | 1.32 ** | 0.45, 2.19 |
| Model 3 | |||
| Past alcohol drinking | Yes vs. No | −0.83 * | −1.51, −0.16 |
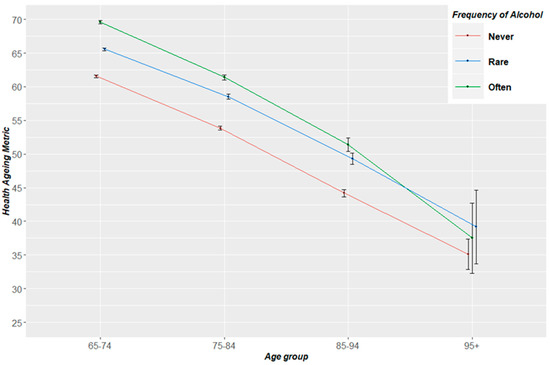
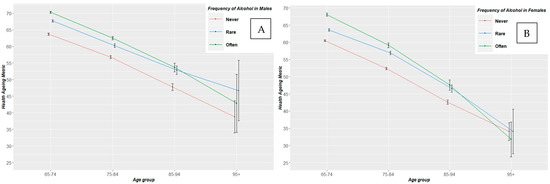
Patterns of health status from the ages of 65 to 95+ years old, by frequency of alcohol drinking, for the pooled sample, are shown in Figure 1. The older never drinking population was the lowest health status trajectory among all age groups. Those with frequent (often-level) alcohol consumption had a better health status trajectory between 65 and 85 years old, followed by those with rare alcohol intake. However, beyond the age group of 85–94 years old, rare or frequent alcohol converged, with rare alcohol intake picturing a better health trajectory among the population of those 95+ years old. Similar trajectories followed when this analysis was applied by gender (Figure 2). Interestingly, only females beyond age of 95 that never consumed alcohol pictured a better health trajectory than those with rare or often consumption.

Figure 1. Trajectories of health status from the ages of 65 to 95+ years old, by frequency of alcohol drinking for the total ATHLOS sample. Health ageing metric ranges from 0–100; Ageing Trajectories of Health: Longitudinal Opportunities and Synergies (ATHLOS).

Figure 2. Trajectories of health status metric from the ages of 65 to 95+ years old by frequency of alcohol drinking for males (A) and females (B). Healthy ageing metric ranges from 0–100.
Table 3. Pooled estimates of the association between healthy ageing and the alcohol intake estimated in the overall sample, by age group, by gender, by wealth status and by super-region.
| Outcome | Categories | b-Coefficient (±SE), R2 | ||||||||||||
|---|---|---|---|---|---|---|---|---|---|---|---|---|---|---|
| 65–80 | 80+ | Males | Females | Poorest | Poorer | Middle | Richer | Richest | Europe | N. and S. America | Asia and Oceania | Africa | ||
| Model 1 | ||||||||||||||
| Frequency of alcohol drinking | Reference | |||||||||||||
| Rare | 4.96 *** (±0.18) | 3.84 *** (±0.43) | −1.49 (±0.78) | −0.19 (±0.60) | −0.36 (±0.82) | 0.20 (±0.84) | −0.87 (±1.13) | −2.53 # (±1.45) | −0.20 (±2.02) | 4.22 *** (±0.17) | 1.21 (±1.63) | 2.25 ** (±0.83) | −1.66 (±2.55) | |
| Often | 6.30 *** (±0.19), R2 = 0.23 | 6.63 *** (±0.48), R2 = 0.19 | 1.10 (±0.81), R2 = 0.30 | 5.62 *** (±0.71), R2 = 0.36 | 3.40 *** (±0.99), R2 = 0.32 | 4.06 *** (±0.94), R2 = 0.32 | 2.50 * (±1.20), R2 = 0.34 | 2.96 # (±1.51), R2 = 0.36 | 4.70 * (±1.86), R2 = 0.32 | 5.90 *** (±0.18), R2 = 0.30 | 13.01 *** (±3.46), R2 = 0.20 | 6.09 *** (±1.06), R2 = 0.19 | 0.14 (±3.43), R2 = 0.08 | |
| Model 2 | ||||||||||||||
| Current alcohol drinking | Yes vs. No | 5.53 *** (±0.16), R2 = 0.23 | 4.97 *** (±0.37), R2 = 0.19 | −0.38 (±0.73), R2 = 0.30 | 2.13 *** (±0.55), R2 = 0.35 | 0.93 (±0.75). R2 = 0.32 | 1.90 * (±0.77), R2 = 0.32 | 0.76 (±1.05), R2 = 0.33 | 0.11 (±1.40), R2 = 0.34 | 3.41 # (±1.79). R2 = 0.31 | 1.32 ** (±0.44), R2 = 0.33 | 2.87 #(±1.55), R2 = 0.19 | 3.59 *** (±0.79), R2 = 0.19 | −1.11 (±2.29), R2 = 0.08 |
| Model 3 | ||||||||||||||
| Past alcohol drinking | Yes vs. No | −0.92 (±1.11), R2 = 0.09 | −8.47 ** (±3.10), R2 = 0.18 | −0.71 (±1.39), R2 = 0.10 | −3.86 * (±1.61), R2 = 0.15 | −3.46 (±2.20), R2 = 0.13 | −5.75 ** (±2.20), R2 = 0.15 | 1.68 (±2.45), R2 = 0.14 | 0.80 (±2.38), R2 = 0.14 | −1.89 (±2.55), R2 = 0.12 | −6.62 *** (±1.58), R2 = 0.28 | 0.54 (±1.73), R2 = 0.20 | −0.76 (±1.46), R2 = 0.10 | −7.72 * (±3.42), R2 = 0.10 |
Models are mutually adjusted for age, sex, BMI, financial and education status, living alone, smoking habits, physical activity and established CVD. # < 0.05, * p < 0.01, ** p < 0.001, *** p < 0.0001. N. and S. America: North and South America.


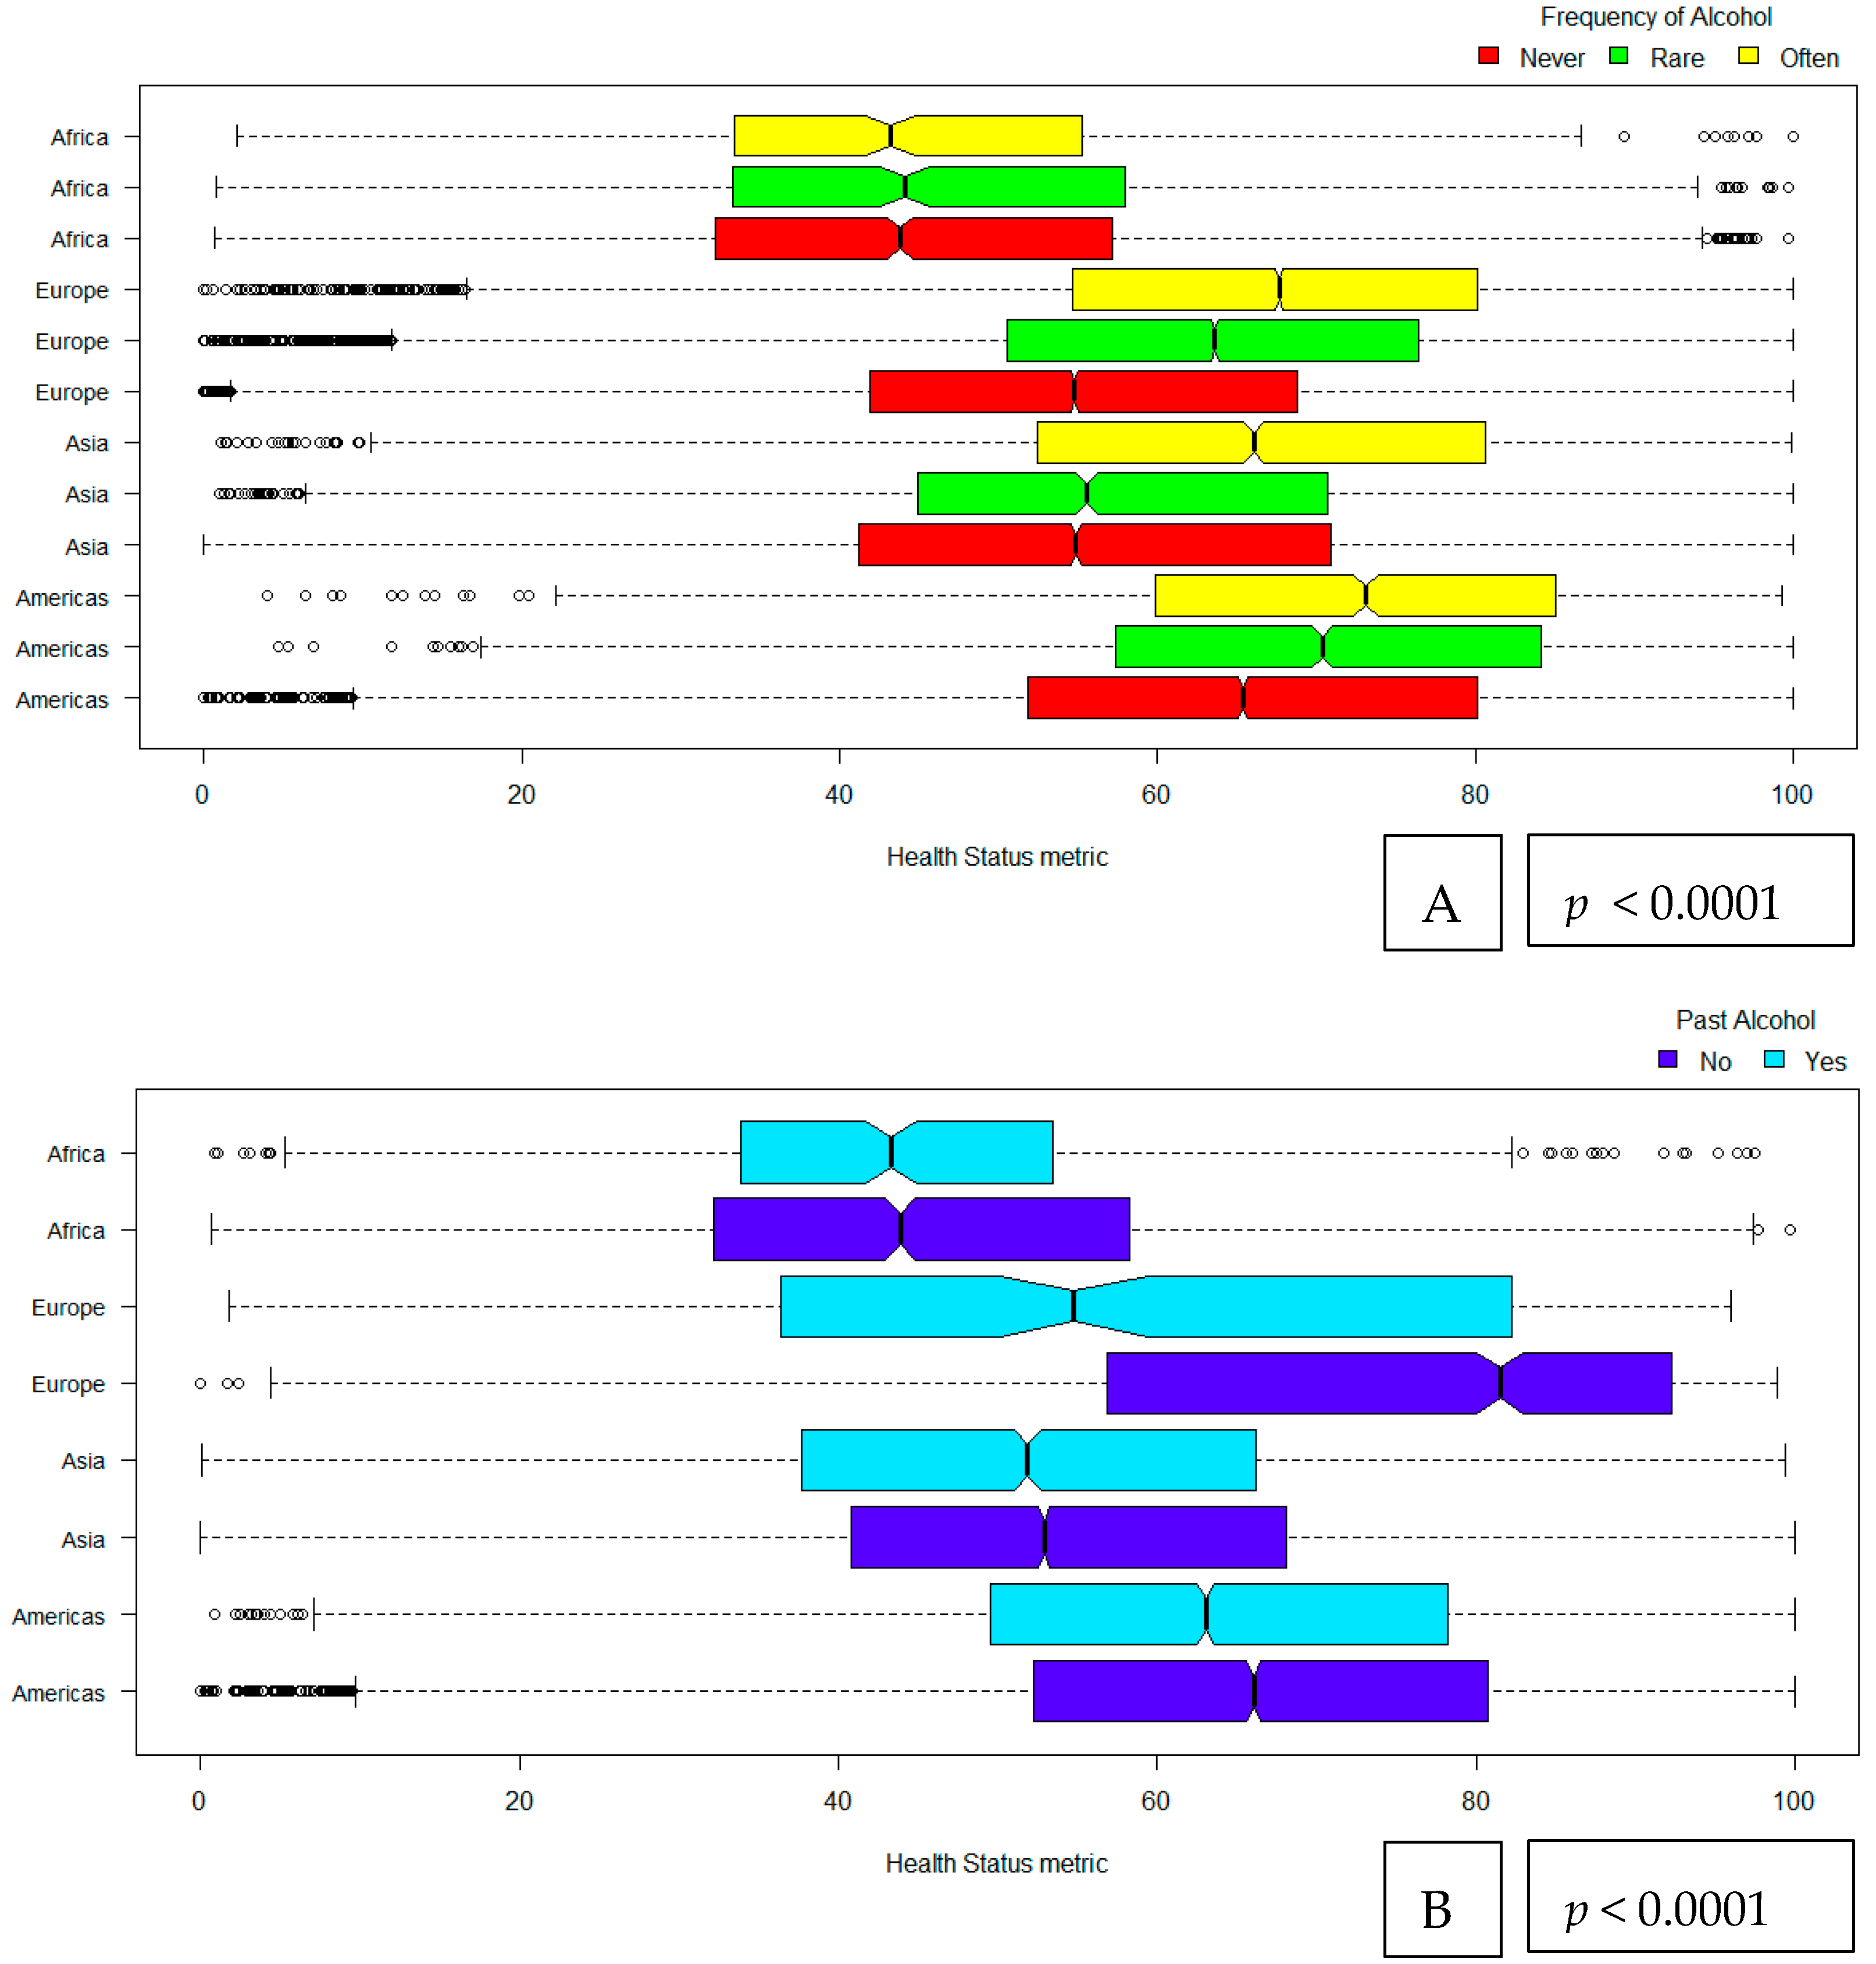
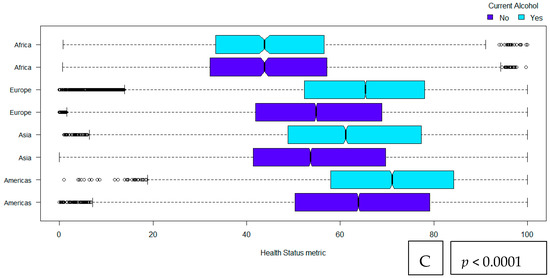
Figure 3. Alcohol drinking [frequency of drinking (A), past drinking (B) and current drinking (C)] and its relationship with health status metric among older adults by super-regions. Frequency of alcohol drinking is expressed as never, rare and often. Past and current alcohol drinking are following a binary categorization of yes vs no. Americas includes the regions of North and South America; Asia includes regions in Asia and Oceania as they are reflected within the ATHLOS data.
4. Discussion
Limitations
5. Conclusions
Author Contributions
Funding
Acknowledgments
Conflicts of Interest
Ethics Approval and Consent to Participate
Consent for Publication
Availability of Data and Material
References
- Rehm, J.; Room, R.; Graham, K.; Monteiro, M.; Gmel, G.; Sempos, C.T. The relationship of average volume of alcohol consumption and patterns of drinking to burden of disease: An overview. Addiction 2003, 98, 1209–1228. [Google Scholar] [CrossRef] [PubMed]
- Rehm, J.; Room, R.; Monteiro, M.; Gmel, G.; Graham, K.; Rehn, N.; Sempos, C.T.; Jernigan, D. Alcohol as a risk factor for global burden of disease. Eur. Addict. Res. 2003, 9, 157–164. [Google Scholar] [CrossRef] [PubMed]
- Overview. Dementia, Disability and Frailty in Later Life—Mid-life Approaches to Delay or Prevent Onset. Guidance. NICE. Available online: https://www.nice.org.uk/guidance/ng16 (accessed on 12 August 2019).
- Ronksley, P.E.; Brien, S.E.; Turner, B.J.; Mukamal, K.J.; Ghali, W.A. Association of alcohol consumption with selected cardiovascular disease outcomes: A systematic review and meta-analysis. BMJ 2011, 342, d671. [Google Scholar] [CrossRef] [PubMed]
- Fillmore, K.M.; Stockwell, T.; Chikritzhs, T.; Bostrom, A.; Kerr, W. Moderate alcohol use and reduced mortality risk: Systematic error in prospective studies and new hypotheses. Ann. Epidemiol. 2007, 17, S16–S23. [Google Scholar] [CrossRef] [PubMed]
- Holmes, M.V.; Dale, C.E.; Zuccolo, L.; Silverwood, R.J.; Guo, Y.; Ye, Z.; Prieto-Merino, D.; Dehghan, A.; Trompet, S.; Wong, A.; et al. Association between alcohol and cardiovascular disease: Mendelian randomisation analysis based on individual participant data. BMJ 2014, 349, g4164. [Google Scholar] [CrossRef] [PubMed]
- Griswold, M.G.; Fullman, N.; Hawley, C.; Arian, N.; Zimsen, S.R.M.; Tymeson, H.D.; Venkateswaran, V.; Tapp, A.D.; Forouzanfar, M.H.; Salama, J.S.; et al. Alcohol use and burden for 195 countries and territories, 1990–2016: A systematic analysis for the Global Burden of Disease Study 2016. Lancet 2018, 392, 1015–1035. [Google Scholar] [CrossRef]
- Forster, L.E.; Pollow, R.; Stoller, E.P. Alcohol use and potential risk for alcohol-related adverse drug reactions among community-based elderly. J. Community Health 1993, 18, 225–239. [Google Scholar] [CrossRef]
- Knott, C.S.; Coombs, N.; Stamatakis, E.; Biddulph, J.P. Cause Mortality and the Case for Age Specific Alcohol Consumption Guidelines: Pooled Analyses of up to 10 Population Based Cohorts. BMJ 2015, 350, h384. Available online: https://www.bmj.com/content/350/bmj.h384 (accessed on 12 August 2019). [CrossRef]
- Kelly, S.; Olanrewaju, O.; Cowan, A.; Brayne, C.; Lafortune, L. Alcohol and older people: A systematic review of barriers, facilitators and context of drinking in older people and implications for intervention design. PLoS ONE 2018, 13. [Google Scholar] [CrossRef]
- Strandberg, A.Y.; Trygg, T.; Pitkälä, K.H.; Strandberg, T.E. Alcohol consumption in midlife and old age and risk of frailty: Alcohol paradox in a 30-year follow-up study. Age Ageing 2018, 47, 248–254. [Google Scholar] [CrossRef]
- Kojima, G.; Jivraj, S.; Iliffe, S.; Falcaro, M.; Liljas, A.; Walters, K. Alcohol Consumption and Risk of Incident Frailty: The English Longitudinal Study of Aging. J. Am. Med. Dir. Assoc. 2019, 20, 725–729. [Google Scholar] [CrossRef] [PubMed]
- Esteban-Cornejo, I.; Cabanas-Sánchez, V.; Higueras-Fresnillo, S.; Ortega, F.B.; Kramer, A.F.; Rodriguez-Artalejo, F.; Martinez-Gomez, D. Cognitive Frailty and Mortality in a National Cohort of Older Adults: The Role of Physical Activity. Mayo Clin. Proc. 2019, 94, 1180–1189. [Google Scholar] [CrossRef] [PubMed]
- Keyes, K.M.; Calvo, E.; Ornstein, K.A.; Rutherford, C.; Fox, M.P.; Staudinger, U.M.; Fried, L.P. Alcohol Consumption in Later Life and Mortality in the United States: Results from 9 Waves of the Health and Retirement Study. Alcohol. Clin. Exp. Res. 2019, 43, 1734–1746. [Google Scholar] [CrossRef] [PubMed]
- Zhu, N.; Yu, C.; Guo, Y.; Bian, Z.; Han, Y.; Yang, L.; Chen, Y.; Du, H.; Li, H.; Liu, F.; et al. Adherence to a healthy lifestyle and all-cause and cause-specific mortality in Chinese adults: A 10-year prospective study of 0.5 million people. Int. J. Behav. Nutr. Phys. Act. 2019, 16, 98. [Google Scholar] [CrossRef]
- Sanchez-Niubo, A.; Egea-Cortés, L.; Olaya, B.; Caballero, F.F.; Ayuso-Mateos, J.L.; Prina, M.; Bobak, M.; Arndt, H.; Tobiasz-Adamczyk, B.; Pająk, A.; et al. Cohort profile: The Ageing Trajectories of Health—Longitudinal Opportunities and Synergies (ATHLOS) project. Int. J. Epidemiol. 2019. [Google Scholar] [CrossRef]
- Sanchez-Niubo, A.; Tyrovolas, S.; Moneta, M.; Prina, M.; Panagiotakos, D.; Caballero, F.; Fortier, I. Data harmonization of longitudinal studies on healthy ageing: The athlos project. Innov. Aging 2017, 1, 1315. [Google Scholar] [CrossRef]
- Caballero, F.F.; Soulis, G.; Engchuan, W.; Sánchez-Niubó, A.; Arndt, H.; Ayuso-Mateos, J.L.; Haro, J.M.; Chatterji, S.; Panagiotakos, D.B. Advanced analytical methodologies for measuring healthy ageing and its determinants, using factor analysis and machine learning techniques: The ATHLOS project. Sci. Rep. 2017, 7, 43955. [Google Scholar] [CrossRef] [PubMed]
- Murray, C.J.L.; Evans, D.B. Policy WHOGP on E for H. In Health Systems Performance Assessment: Debates, Methods and Empiricism; World Health Organization: Geneva, Switzerland, 2003; ISBN 978-92-4-156245-4. [Google Scholar]
- UNESCO Institute for Statistics International Standard Classification of Education: ISCED 2011; UNESCO Institute for Statistics: Montreal, QC, Canada, 2012; ISBN 978-92-9189-123-8.
- Graham, K. Alcohol Abstention among Older Adults: Reasons for Abstaining and Characteristics of Abstainers. Addict. Res. 1998, 6, 473–487. Available online: https://www.tandfonline.com/doi/abs/10.3109/16066359809004366 (accessed on 12 August 2019). [CrossRef]
- Tsubono, Y.; Yamada, S.; Nishino, Y.; Tsuji, I.; Hisamichi, S. Choice of comparison group in assessing the health effects of moderate alcohol consumption. JAMA 2001, 286, 1177–1178. [Google Scholar] [CrossRef]
- St-Onge, M.-P.; Gallagher, D. Body composition changes with aging: The cause or the result of alterations in metabolic rate and macronutrient oxidation? Nutrition 2010, 26, 152–155. [Google Scholar] [CrossRef]
- Davy, K.P.; Horton, T.; Davy, B.M.; Bessessen, D.; Hill, J.O. Regulation of macronutrient balance in healthy young and older men. Int. J. Obes. Relat. Metab. Disord. 2001, 25, 1497–1502. [Google Scholar] [CrossRef] [PubMed]
- DrinkWise. Age and Alcohol: Understand the Effects of Drinking as You Get Older. Available online: https://drinkwise.org.au/drinking-and-you/age-and-alcohol-understand-the-effects-of-drinking-as-you-get-older/# (accessed on 12 August 2019).
- Agahi, N.; Dahlberg, L.; Lennartsson, C. Social integration and alcohol consumption among older people: A four-year follow-up of a Swedish national sample. Drug Alcohol Depend 2019, 196, 40–45. [Google Scholar] [CrossRef] [PubMed]
- Huckle, T.; You, R.Q.; Casswell, S. Socio-economic status predicts drinking patterns but not alcohol-related consequences independently. Addiction 2010, 105, 1192–1202. [Google Scholar] [CrossRef] [PubMed]
- Jones, L.; Bates, G.; McCoy, E.; Bellis, M.A. Relationship between alcohol-attributable disease and socioeconomic status, and the role of alcohol consumption in this relationship: A systematic review and meta-analysis. BMC Public Health 2015, 15, 400. [Google Scholar] [CrossRef] [PubMed]
- Erskine, S.; Maheswaran, R.; Pearson, T.; Gleeson, D. Socioeconomic deprivation, urban-rural location and alcohol-related mortality in England and Wales. BMC Public Health 2010, 10, 99. [Google Scholar] [CrossRef] [PubMed]
- Kunzmann, A.T.; Coleman, H.G.; Huang, W.-Y.; Berndt, S.I. The association of lifetime alcohol use with mortality and cancer risk in older adults: A cohort study. PLoS Med. 2018, 15. [Google Scholar] [CrossRef]
- Hu, Y.; Pikhart, H.; Malyutina, S.; Pajak, A.; Kubinova, R.; Nikitin, Y.; Peasey, A.; Marmot, M.; Bobak, M. Alcohol consumption and physical functioning among middle-aged and older adults in Central and Eastern Europe: Results from the HAPIEE study. Age Ageing 2015, 44, 84–89. [Google Scholar] [CrossRef]
- Shelton, N.; Savell, E. The geography of binge drinking: The role of alcohol-related knowledge, behaviours and attitudes. Results from the Health Survey for England 2007. Health Place 2011, 17, 784–792. [Google Scholar] [CrossRef]
